About INTENS and INTENS-CCN
INTENS (Characterization of IoNospheric TurbulENce level by Swarm constellation) is developed through two phases: the first part of the project lasted about one year, from December 2019 to February 2020. The main outcomes of this first part are summarized here.
After successfull completion of the proposed tasks, ESA granted the INTENS team an extension of six further months, starting from August 2020. This second part of the project, named INTENS-CCN, is focused on two specific aspects that gave the most promising results in the first part of the project. The main results of INTENS-CCN are summarized here.
1. The first part of the INTENS project
The study of the Sun-Earth relationship, in terms of the dynamical response of the near-Earth space to the solar wind forcing, can be considered as the background for Space Weather, and the high-precision measurements of the Earth’s magnetic field and plasma parameters that Swarm delivers may offer new insights towards new science discoveries related to these phenomena.In this framework, the characterisation of the role that magnetospheric activity plays in the ionospheric plasma dynamics and magnetic field variations is extremely relevant. A high priority has the understanding of how local, regional, and global-scale phenomena couple to produce the complex responses observed. Turbulence provides one pathway by which energy moves from large to small scales, where energy is dissipated in the form of heating and creates multi-scale complex structures. The ionospheric environment is a complex system where, due to the coupling with the magnetosphere and solar wind, highly dynamic phenomena, such as turbulence (fluid and magnetohydrodynamics-MHD) and plasma instabilities, generally occur.
The INTENS project aims at investigating the nature of fluctuations and their scaling features in the magnetic field and plasma parameters (electron density and temperature) during different geomagnetic disturbance conditions to unveil the role played by MHD turbulence on ionospheric environment in creating multi-scale plasma structures and plasma inhomogeneities. The analysis of Swarm constellation measurements of the Earth's magnetic field (at both high, 50 Hz, and low, 1 Hz, resolution) as well as electron density and temperature will allow us to achieve this goal. The knowledge of these parameters will provide a characterisation of the nature and level of ionospheric turbulence on a local scale, which can be displayed either along a single satellite orbit or through daily maps over the region of interest. These parameters will be also used to study space-climatological variations of the scaling features of the magnetic field and electron density according to different geomagnetic disturbance conditions and interplanetary magnetic field (IMF) orientations. Swarm measurements will provide a precise characterisation of the different ionospheric turbulence regimes of the medium crossed by Swarm constellation (on scales from hundreds of kilometres to a few kilometres, using low resolution data, and from tens of kilometres to a few meters, using data at the highest resolution). The obtained results will be compared with previously numerical and experimental published works and discussed in the global framework of ionospheric turbulence.
Finally, the analysis performed at high latitudes for both hemispheres will allow a thorough investigation of the North-South asymmetries, while the analysis at mid and low latitudes will allow an improved understanding of the impact of magnetospheric ring current variations on ionospheric plasma at Swarm altitude, which in the near future could be useful for magnetic storm forecasting.
The main objectives to be achieved in this project are:
- Analysis of the statistical properties (scaling features) of electron density and temperature fluctuations in the F region of the ionosphere (at about 500 km of altitude) according to different geomagnetic activity levels and IMF orientations. This analysis would also involve the investigation of the local thermodynamic parameters, such as entropy and internal energy, and their changes with the geomagnetic activity level, assuming the occurrence of local thermodynamic equilibrium condition.
- Analysis of scaling features of the meso-scale (10 – 400 km) fluctuations of the magnetic field of external origin parallel and perpendicular to the direction of the main field, according to different geomagnetic activity levels and IMF orientations. Analysis of the isotropic/anisotropic nature of the magnetic turbulence in the ionosphere.
- Analysis of the daily variations of the scaling features of magnetic field and electron density, during the development of some intense/moderate geomagnetic storms occurred in the investigated time period.
- Analysis of various aspects of the dynamical complexity of the magnetosphere-ionosphere system related to intermittent turbulence (non-stationarity, nonlinearity, multi-scale variability, internal dynamics vs. external forcing), using wavelet transforms and information theory approaches. This point naturally arises from the fact that intermittent turbulence in magnetized space plasmas is a manifestation of dynamical complexity (see, for instance, Bruno and Carbone, 2013, mentioned in the Insights page).
The goals to be targeted are:
- Characterisation of the ionospheric turbulence level for different latitudinal regions and magnetic local times according to different geomagnetic activity levels and IMF orientations. This is a critical issue in the comprehension of some physical mechanisms, at the base of plasma instabilities and ionospheric irregularities, and that are of particular interest for Space Weather applications.
- Generation of average maps of all the parameters describing the scaling features of the magnetic field electron density aimed to characterize the nature of turbulence in the F-region of the ionosphere, under different conditions of geomagnetic disturbance.
- Dynamical description of the investigated statistical quantities (scaling indices, spectral properties) and plasma parameters (electron density, temperature, thermodynamic quantities) during the development of a typical geomagnetic storm. This point will be corroborated also by the inclusion of other reference datasets (e.g., data recorded by ground-based magnetometers and HF-radars, such as SuperDARN).
- Enhancement of Space Weather forecasting capabilities, since the application of information-theory approaches to Swarm data analysis targeted to extreme Space Weather events (i.e, magnetospheric substorms and magnetic storms) will provide new and more descriptive parameters. These will significantly improve the application of machine learning algorithms, which are omnipresent in today’s Space Weather forecasting schemes.
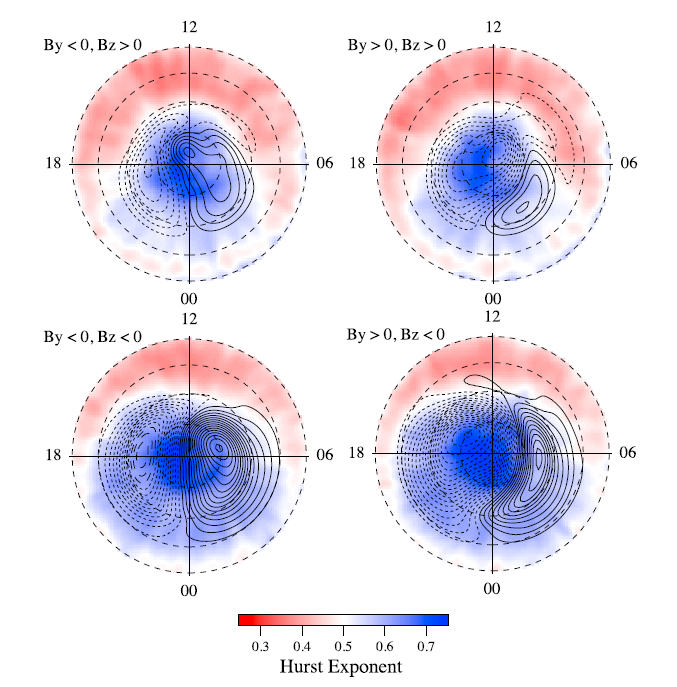
An example of what we mean with “scaling features” of the geomagnetic field can be seen in the figure below, taken from a paper by De Michelis et al., 2017. Four polar maps of the Northern Hemisphere can be observed, showing the distributions of the “Hurst Index” for four different average configurations of the Interplanetary Magnetic Field (IMF). The Hurst index is calculated, in this case, from the horizontal component of the geomagnetic field, as measured by Swarm A over one year (April 2014 – April 2015), and is defined as the scaling exponent of first order structure function, \(S\), of geomagnetic field fluctuations:
where \(H(t)\) is the horizontal component of the geomagnetic field as a function of time, \(t\), \(\Delta t\) is the variable delay, and \(\lt\)…\(\gt\) stands for a statistical average.
In the case of a time series analysis, the Hurst exponent, which ranges between 0 and 1, is used as a benchmark to evaluate the persistence, randomness, or antipersistence feature of a system. We have \(\xi = 0.5\) when the time series describes a regular Brownian motion, \(\xi \gt 0.5\) when the time series has a persistent character, and \(\xi \lt 0.5\) when we consider a time series with an antipersistent character. Finally, for a white noise \(\xi = 0\), while for a simple linear trend \(\xi = 1\). Thus, the Hurst exponent is capable of describing the tendency of a time series both to regress to the mean (when \(\xi < 0.5\)) and to cluster in a direction (when \(\xi > 0.5\)).
Figure 1 below shows that the fluctuations of the geomagnetic field have generally a persistent character at very high latitudes in the polar cap, and an antipersistent character at lower latitudes in the auroral oval. When the \(B_z\) component of the IMF is negative, more energy is injected in the magnetosphere-ionosphere system, and the persistent region (\(\xi \gt 0.5\)) expands to lower latitudes, especially on the night side.
Although preliminary studies on ionospheric turbulence and scaling properties making use of Swarm data have been already done and published (as shown, e.g., in the example above), a comprehensive worldwide study using both magnetic and plasma data, recorded at the same time and in the same place has never been done before. INTENS aims at filling this gap.
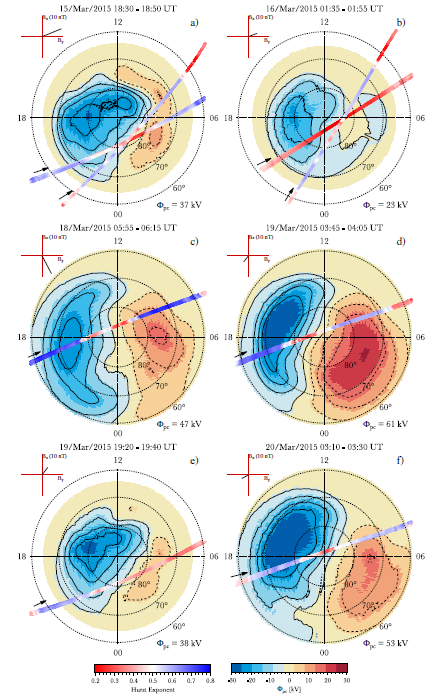
Another important aspect that INTENS will treat is the development and characterization of turbulence and complexity during six geomagnetic storms occurred between April 2014 and March 2018. This task will be carried out using different methods and approaches, and adding auxiliary datasets. As an example of multiparametric study, one can see in Figure 2 the daily evolution of the Hurst exponent calculated on the detrended time series of the "external" (difference between the measured field value and the modelled field value of the core and crust) horizontal component of the geomagnetic field as measured by Swarm during the development of the famous "St. Patrick storm" (15-20/03/2015). The Hurst exponent behaviour is displayed over selected passes of Swarm A and, where possible, Swarm B, through the Northern polar cap, superimposed to the average contours of the large scale electrostatic potential as inferred from Doppler radar backscatter measurements of the SuperDARN network. An interesting correlation seems to exist between the behaviour of the Hurst exponent and the value of the polar cap potential (\(\Phi_{PC}\)). Indeed, for high values of \(\Phi_{PC}\) and negative values of the IMF \(B_z\) component (see for instance plate (d) and (f) in Figure 2) a clear structure of the magnetic field fluctuations character is found in coincidence with the occurrence of a stable double-celled convection pattern. Conversely, for small values of \(\Phi_{PC}\) and/or positive values of IMF \(B_z\) component, the highly structured character of the magnetic field fluctuations is lost. This last observation is supported by Figure 2b when a single cell is found when \(B_z \gt 0\) and \(\Phi_{PC} \lt 20\) kV (De Michelis et al., 2016).
2. The extension of INTENS: INTENS-CCN
Towards Swarm based geomagnetic indices
In the previous phase of INTENS, new geomagnetic indices based on Swarm magnetic field data were computed for a number of selected geomagnetic storms. These indices are similar to ground-based geomagnetic Dst (or SYM-H) and AE indices, and are based on perturbations of magnetic field components perpendicular to the main field, measured by Swarm in the low and high latitude regions.
In particular, for Swarm based-Dst, all the data sampled by Swarm in the \(-40° \lt Mlat \lt +40°\) magnetic latitude range are considered; while for the Swarm-based AE the Swarm data in the latitude range \(Mlat \gt +50°\) in the Northern or \(Mlat \lt -50°\) in the Southern Hemisphere are used. The comparison of Swarm-based with ground-based geomagnetic indices showed a very good agreement (correlation coefficient exceeding 0.9), demonstrating that Swarm magnetic field data can be used to provide new satellite-based global indices to monitor the ionospheric activity during geomagnetic storms. In addition, the Swarm-based indexes have advantages when compared to ground-based ones:
- The Swarm Dst-like index should provide a better time resolution than standard ground-based Dst.
- The Swarm AE-like index should be more representative of a global state, since it is based on measurements from both hemispheres, while the ground-based one is computed from measurements in the Northern Hemisphere only.
Conversely, a disadvantage of a Swarm-based geomagnetic index is related to the continuity of time series: with only two satellites, sometimes none of them is in the correct latitude range to compute the index, resulting in gaps in indices unless adopting some interpolation. On the contrary, the ground-based indices are based on several ground magnetic observatories, which provide continuous time series of magnetic field data.
In this CCN, it is proposed to go beyond the initial derivations of the Swarm based AE and Dst indices and elucidate certain aspects and properties of these new indices: to further explore and enhance the potential capabilities and new synergies offered by the combined use of the new Swarm-based global indices with ground-based ones. The outcome of this task will also allow to identify the best possible Swarm-based indices and will contribute to pave the way for the operational generation of new synergetic products aiming at better monitoring the status of geomagnetic activity.
Electron density irregularities and turbulence
In the previous phase of INTENS we analyzed the daily patterns of the scaling parameters related to the electron density (Hurst exponent, \(\gamma (2)\), and intermittency, see the Results of INTENS page for more details) during five selected geomagnetic storms and we started investigating a possible relation between them and the occurrence of plasma density irregularities as described by the Rate Of change of electron Density Index (the so-called RODI), used to quantify the structuring of the ionospheric plasma and as a proxy of ionospheric plasma irregularities (see also De Michelis et al., 2020, reported in the Papers & Presentations page).
This preliminary analysis for the St. Patrick’s geomagnetic storm (16-22 March 2015) at high latitudes, highlighted two families of plasma irregularities that seem to be associated with different physical properties: 1) Plasma density variations associated with low values of RODI that are characterized by scaling properties not supporting the idea of a fluid and/or magnetohydrodynamic (MHD) turbulence as a source of these perturbations; 2) Plasma density variations associated with high RODI values and scale-invariant anti-persistent fluctuations that are characterized by spectral properties similar to those expected in the case of fluid and/or MHD turbulence.
This evidence suggests that RODI cannot be generically considered as a proxy of the occurrence of ionospheric turbulence. Nevertheless, it is true that highest values of RODI can give information on the possible turbulent origin of plasma irregularities. The objectives of our extended studies will therefore be:
- To generalize the results obtained for the single example of the St. Patrick’s storm, extending the comparison between the scaling parameters and RODI to other storm periods. At the same time, we will explore what happens for a number of selected geomagnetically quiet periods. The analysis will be performed both at high and low latitudes, with the goal in mind to try to set a threshold of RODI beyond which the irregularities could be linked to turbulent processes.
- To verify the hypothesis according to which the electron density disturbances associated with loss-of-lock of the GPS signals are characterized by scaling properties that support the idea of a fluid and/or MHD turbulence as a source of these phenomena.