Results of the INTENS-CCN
1. Electron density irregularities and turbulence
1.1 High-Latitude climatology
The first step of investigation in the framework of INTENS-CCN has been to try to generalize the evidences found for the 2015 St. Patrick's storm event concerning the relationship between the Rate Of change of electron Density Index (RODI) and the first- (H) and second-order (\(\gamma(2)\)) scaling exponents and intermittency (I). Such preliminary results were described here.
The initial target was to extend the analysis done for the 2015's St. Patrick's storm to five other storm periods contained in the INTENS dataset; moreover we meant to select a number of "superquiet" periods, evenly distributed in local time, possibly temporarily close to the storm events. The idea was to use these periods in order to verify the possible existence of properties similar to those observed for the disturbed ones. Unfortunately, the task to select very quiet periods long enough to be compared to the storm periods and, at the same time, uniformly quiet at all latitudes is not an easy one.
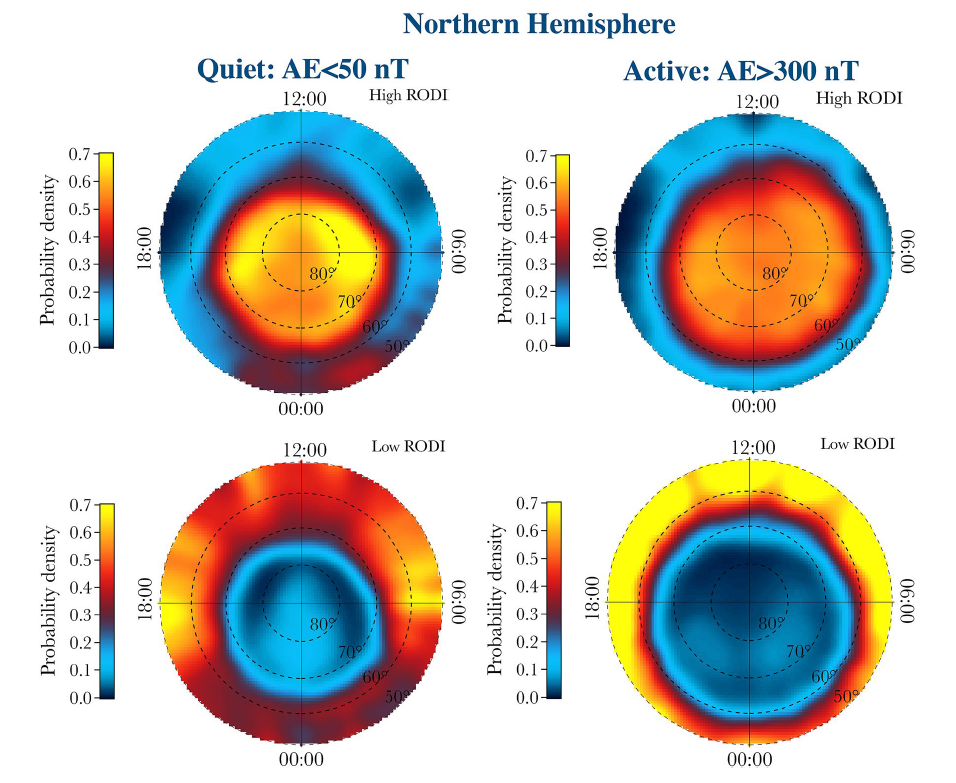
We therefore considered two datasets, created in the first part of the INTENS project, corresponding to "quiet" (AE \(\lt\) 50 nT) and “severe" (AE \(\gt\) 300 nT) geomagnetic conditions for Swarm A, so switching to a more suitable climatological approach. For each dataset we evaluated the joint probability distributions between RODI and the first-order scaling exponent, the second-order scaling exponent and intermittency, respectively. The results are detailed in De Michelis et al. (2021a). Here, we just summarize the main outcomes:
- Two different families of plasma density fluctuations characterized by different mean values of scaling exponents and RODI can be identified in the whole dataset. The first population is characterized by antipersistency, \(\beta\) = \(\gamma(2)\) + 1 < 2 and high values of RODI; the second population is characterized by persistency, \(\beta\) > 2 and low values of RODI.
- The two populations dominate in different latitudinal regions: the first one is dominant in the auroral oval and in the polar cap (above/below \(\pm\) 65° - 70° magnetic latitude); the second one is dominant in the subauroral region (below/above \(\pm\) 60° - 65° magnetic latitude)
- These findings suggest that, in general, the first population could be due to turbulent mechanisms mainly generated by the Gradient Drift Instability (GDI), which is favoured by the large scale convection in the auroral oval and in the polar cap; the second population instead shows spectral features that remind random turbulent fluctuations in regions where a density enhancement is observed in correspondence with plasma coming from the inner magnetospheric regions.
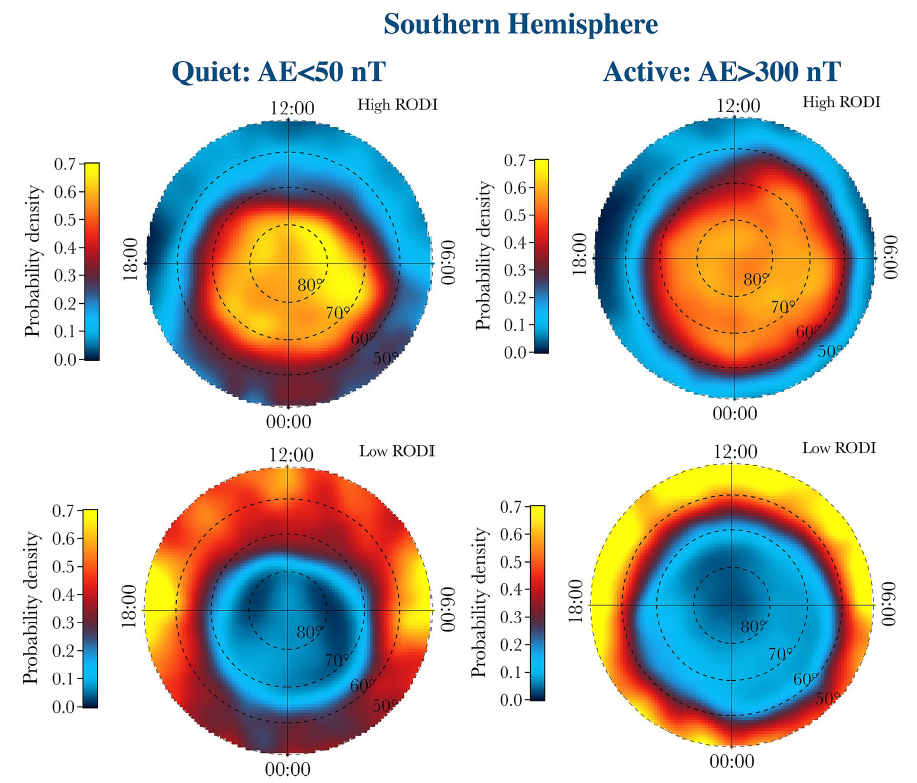
Figure 1 shows the probability densities of such two populations in the Northern and Southern hemispheres and as a function of the geomagnetic activity. During active times, one can see the High RODI population expanding towards lower latitudes especially in the dayside/morning sector.
1.2 Low-Latitude phenomena
The phenomenology of plasma density irregularities at low latitudes is dominated by the so-called Equatorial Plasma Bubbles (EPB). EPBs are plasma structures aligned to the geomagnetic field in the night-time equatorial ionosphere where plasma density is from 1 to 3 orders of magnitude lower than the environmental one. The typical size of these plasma depletions ranges from a few meters to hundreds of kilometers and their distribution in space and time is controlled by different geophysical parameters: local time, latitude, longitude, season, geomagnetic activity, and solar activity. At the border and inside EPBs density fluctuations are observed, whose energy spectra obey to a power-law scaling suggesting their possible turbulent character.
Among the Swarm products distributed by ESA there is the Ionospheric Bubble Index (IBI, details here) which we have used to identify the EPBs, focusing on the most favourable conditions for an EPB occurrence: range of \(\pm\) 40° in geographic latitude, local time sector ranging from 18:00 to 24:00, high/moderate solar activity (from 1 April 2014 to 31 January 2016, where average index F10.7 was equal to 100 \(\pm\) 30 sfu), low geomagnetic activity (index Kp \(\le\) 3). Once selected the intervals when the Swarm A spacecraft crossed an EPB, we calculated the first-order scaling exponent, the second-order scaling exponent and intermittency related to electron density fluctuations. Successively, we calculated the joint probability distributions between RODI and such quantities, similarly to what we have done for the high latitude studies. The results are discussed in detail in De Michelis et al. (2021b); here we just summarize the main outcomes:
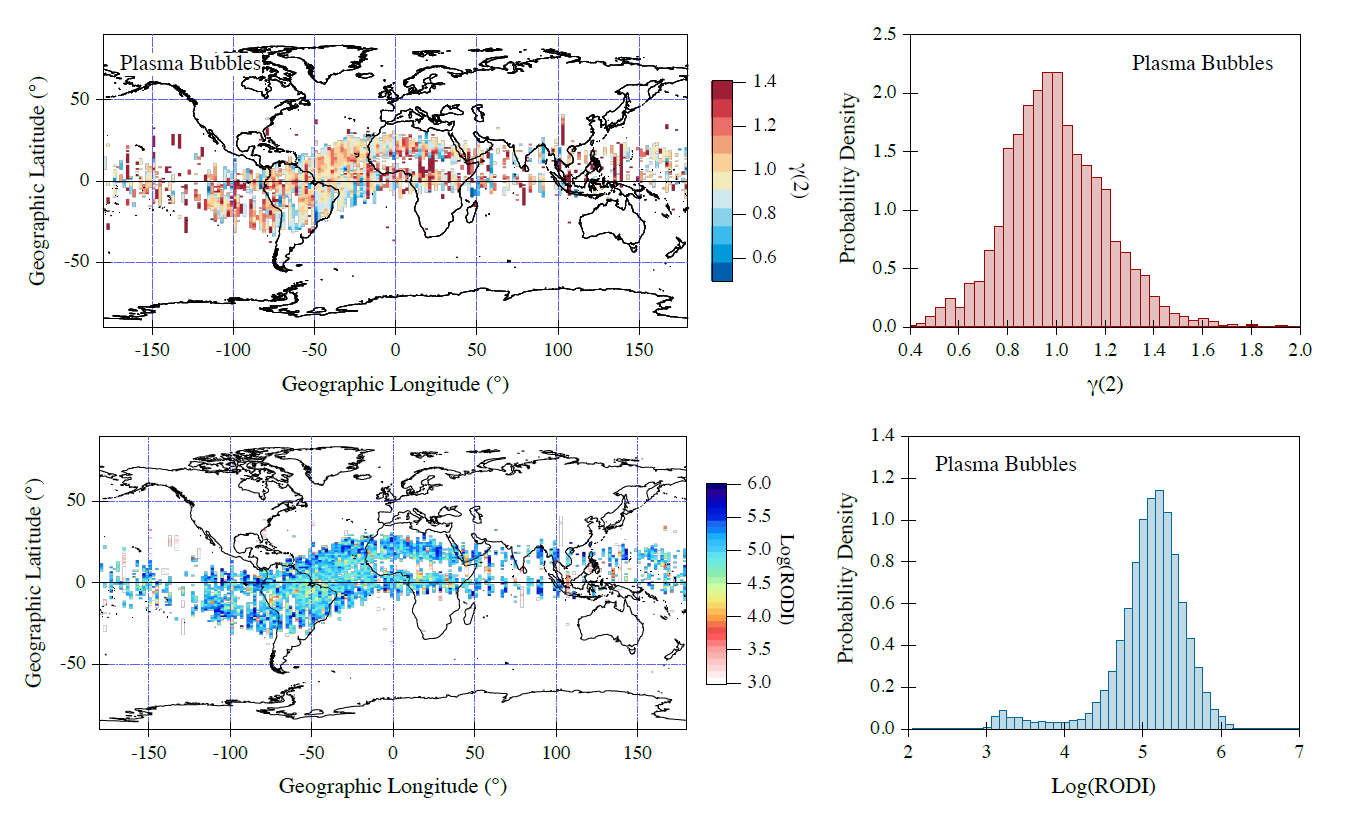
- Figure 2, upper panels, clearly shows that inside the plasma bubbles the 2nd-order structure function exponent in the investigated range of time scales spreads from 0.4 to 2 with the highest probability occurring for values around (0.98 \(\pm\) 0.21). Differently, the same quantity associated with the electron density fluctuations in the environment where the plasma bubbles are detected (not shown, please refer to De Michelis et al. (2021b) for full details), though covers the same range between 0.4 and 2, shows values which cluster around 2. This result suggests a dynamics of the electron density fluctuations significantly different inside and outside plasma bubbles. The different character of the fluctuations inside the plasma bubbles, as suggested by the values of \(\gamma\)(2), could be due to the proposed turbulent origin of these irregularities at least at Swarm A altitude (\(\sim\) 460 km).
- As shown in Figure 2, lower panels, inside the plasma bubbles RODI reaches high values (> 104 cm-3 s-1) which are not observed outside these irregularities where the mean value of RODI is around 103 cm-3 s-1.
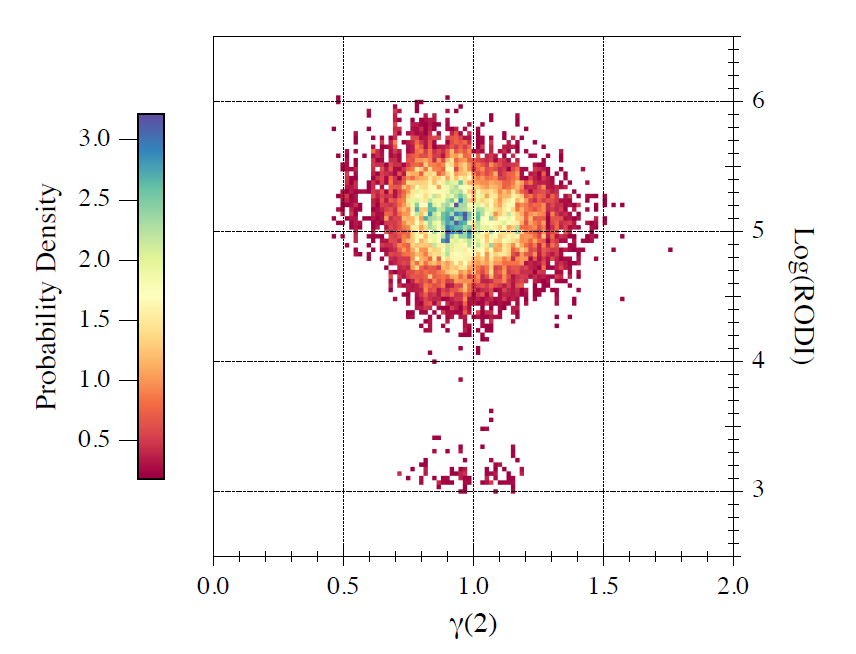
- Figure 3 represents even more clearly the relationship between RODI and turbulence in the ionospheric electron density, also in the equatorial region: the joint probability distribution shows that it is possible to set a minimum value of RODI equal to 104 cm-3 s-1 above which the index is able to identify the EPBs, that are related to turbulent processes.